Know
Where the market is, in seconds
Both fuels, day-ahead to the back of the curve, on one screen. Nothing to assemble and no spreadsheet doing the rounds.
Index is a trading terminal built for energy consultancies and third-party intermediaries. Both fuels, day-ahead through to the back of the curve, on one screen that fits a normal monitor without scrolling. Nothing to install, and every person on the desk gets their own login.

Built on a working UK energy desk, and in daily use on it. The tools are built round what a desk does with a price.
When a client asks where the market is, the answer has to come in seconds, in a form they will read. It also has to stand up later. Index is built for all three.
Both fuels, day-ahead to the back of the curve, on one screen. Nothing to assemble and no spreadsheet doing the rounds.
Copy any chart into an email, export the history to a formatted workbook, send a client their position report.
Roll the whole screen back to any date with the time machine, and plot a client's trades against the market they were struck in.
Everything a desk reaches for in a session, arranged so the market is in front of you rather than three clicks away.
Gas and power, the front months and seasons for each fuel, rolling automatically, with day-ahead on top.
Click a contract to load it. Month, season and annualised charts, each with a 14-day RSI.
Every listed month for both fuels on one chart. Drag across it to mark a period and read the stats.
Every forward season in one list. Run down it and each chart draws on a shared axis.
Full price history to a formatted workbook. Any chart copied as an image, ready for a client.
Switch the whole screen between native units and p/kWh. Tables, charts and exports move together.
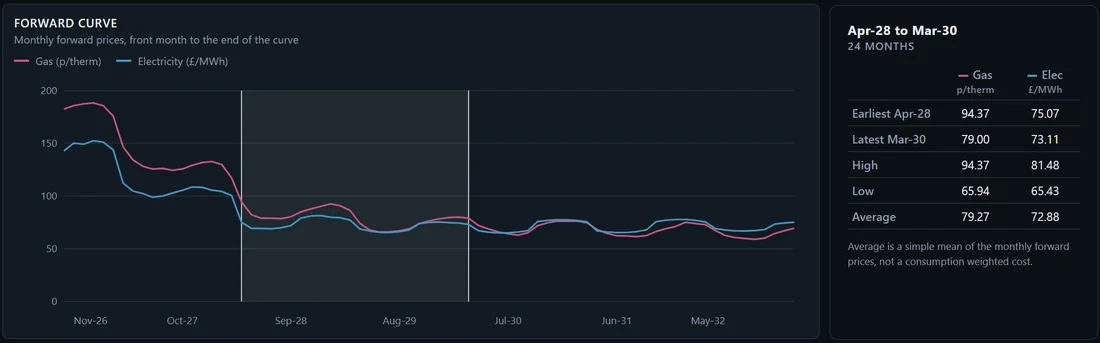
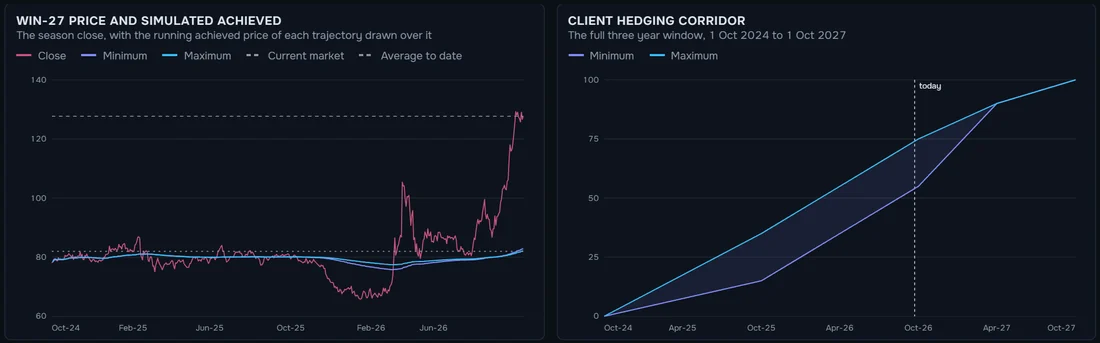
Pick one to see it. Each is a capture from the terminal, and the PPA Exchange is shown from its demo build. The tour goes through them tier by tier.
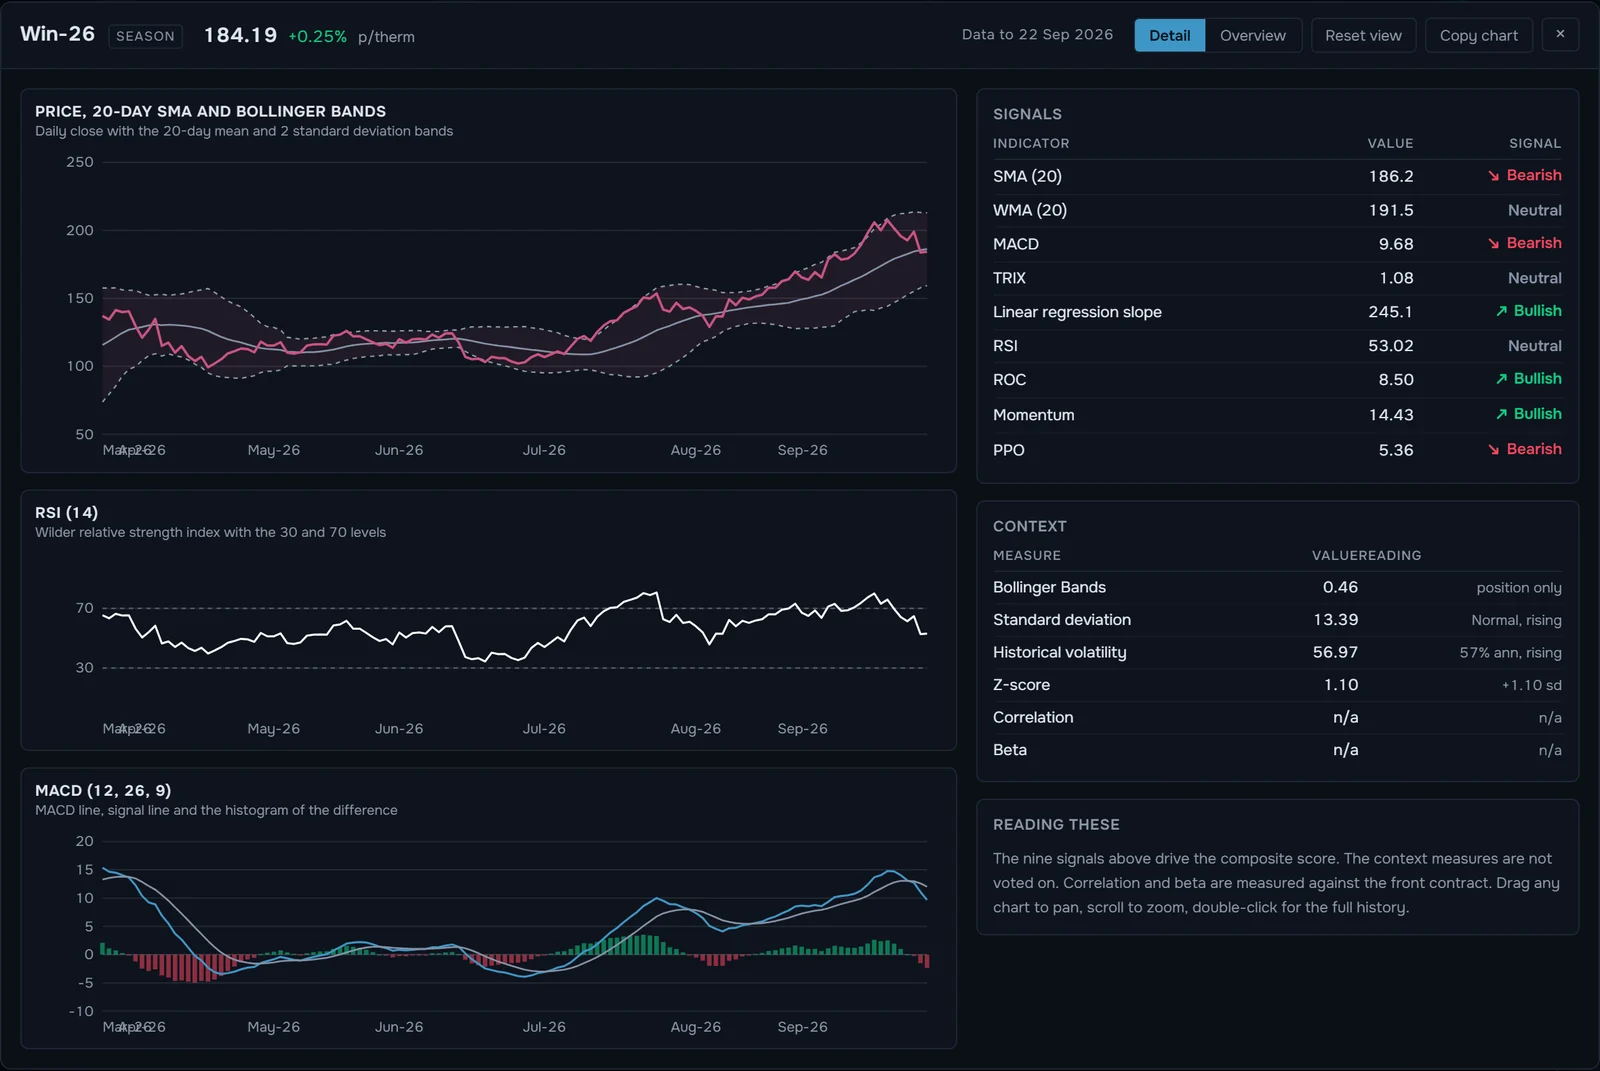
Technical analysis. Right-click any contract for 15 indicators, nine of them voting on one verdict with a confidence score. A reading of the indicators, not a house view.
Pro and Ultimate
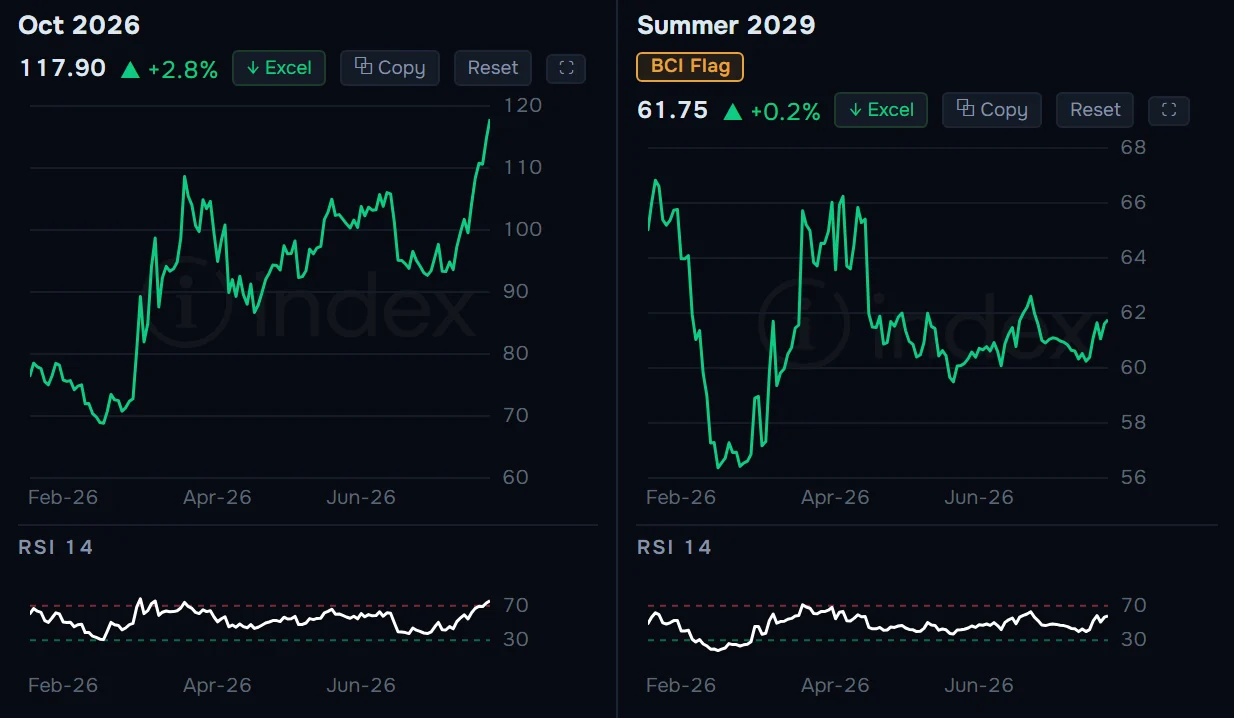
Band Compression Index. Our own indicator. It weighs several statistical measures of a contract's volatility against its recent price action and flags when that market has gone unusually quiet. Volatility tends to move in cycles, so a quiet spell is often where a bigger move starts.
Pro and Ultimate
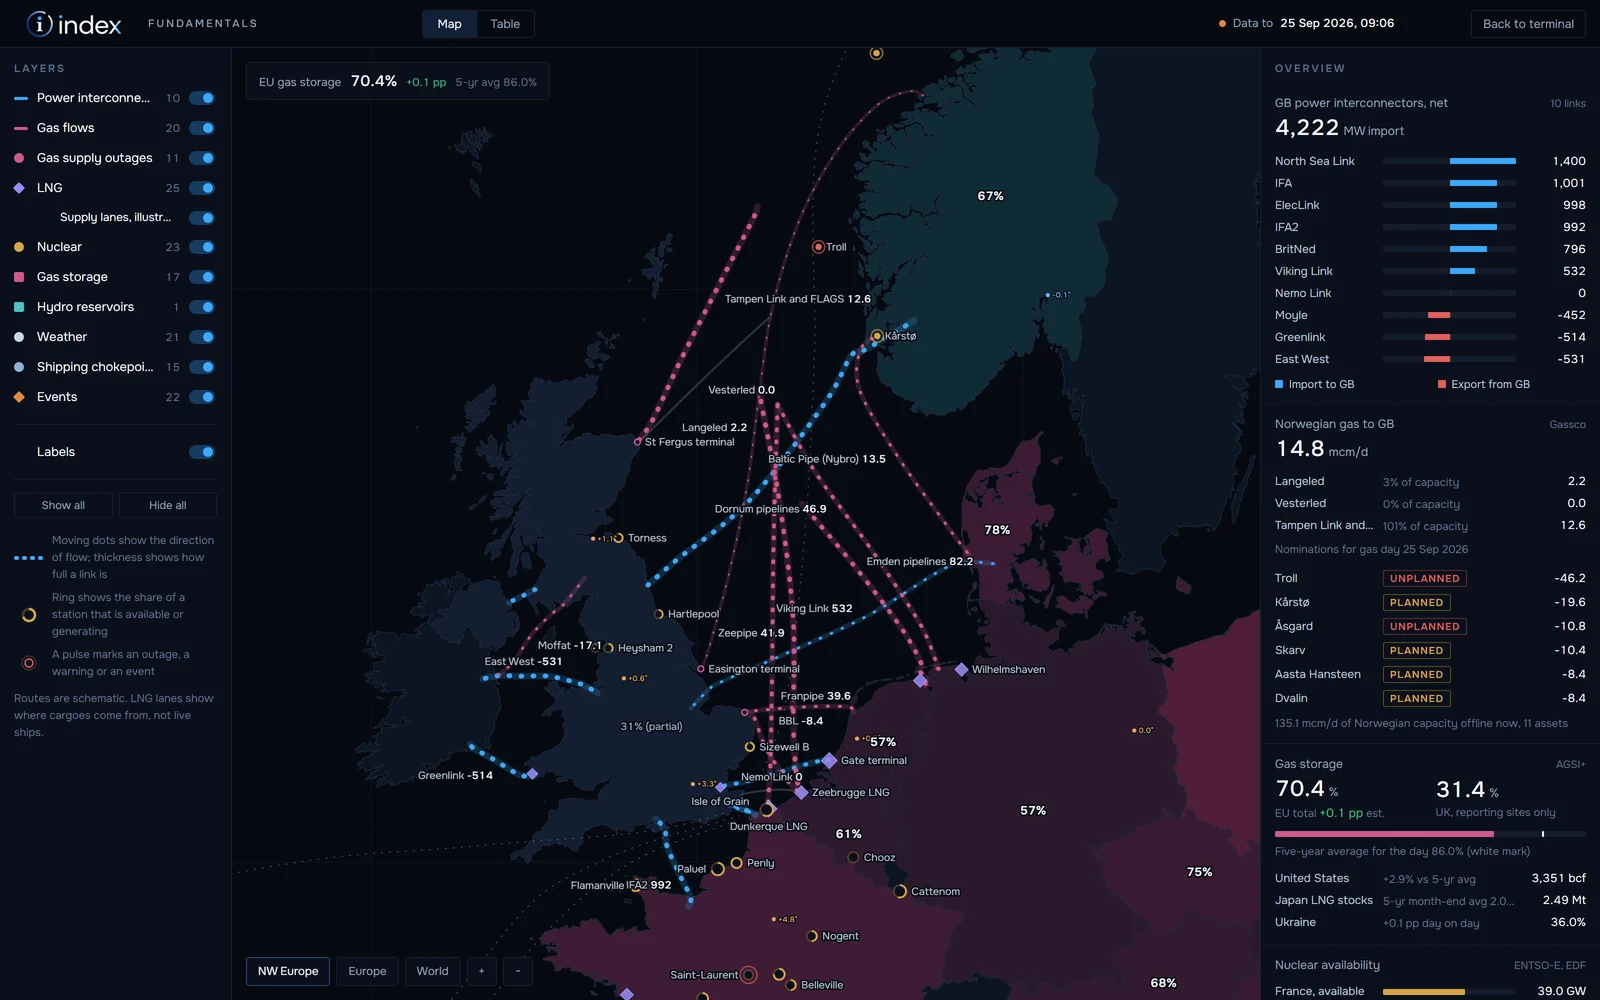
Fundamentals. Storage, flows, outages and the generation mix behind the curve, on one full-page map with the figures beside it.
Pro and Ultimate
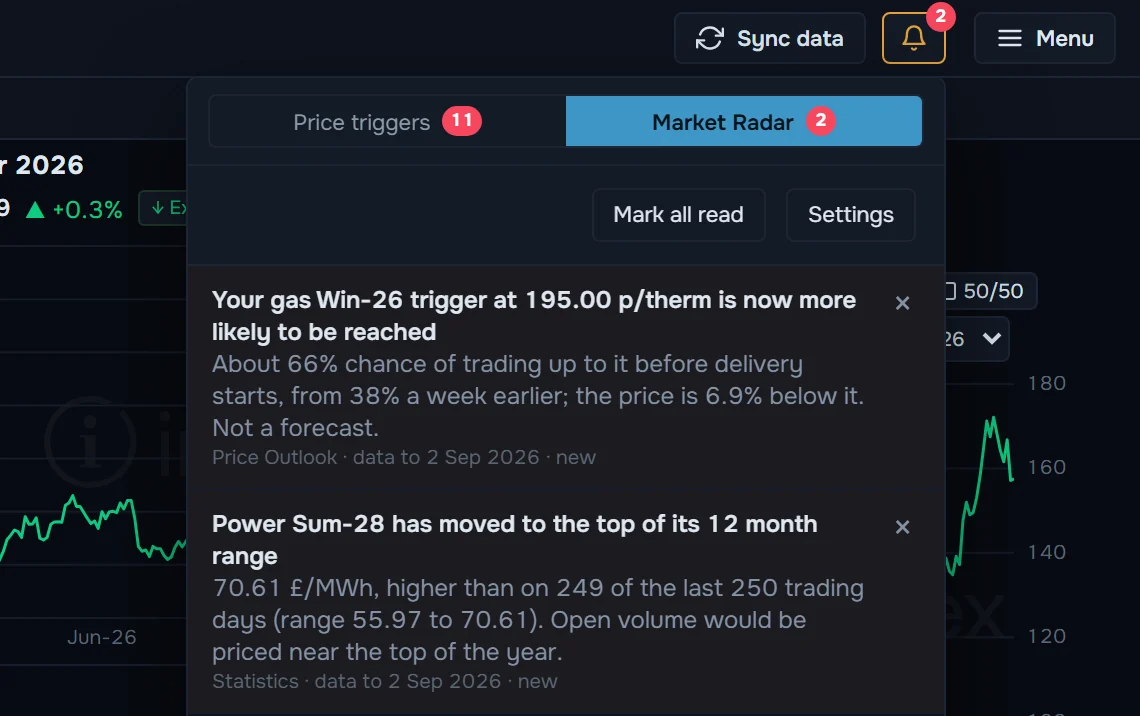
Market Radar. Alerts under the bell when a market changes regime, such as a season moving to the top of its 12-month range. Price triggers sit beside it from Plus.
Pro and Ultimate
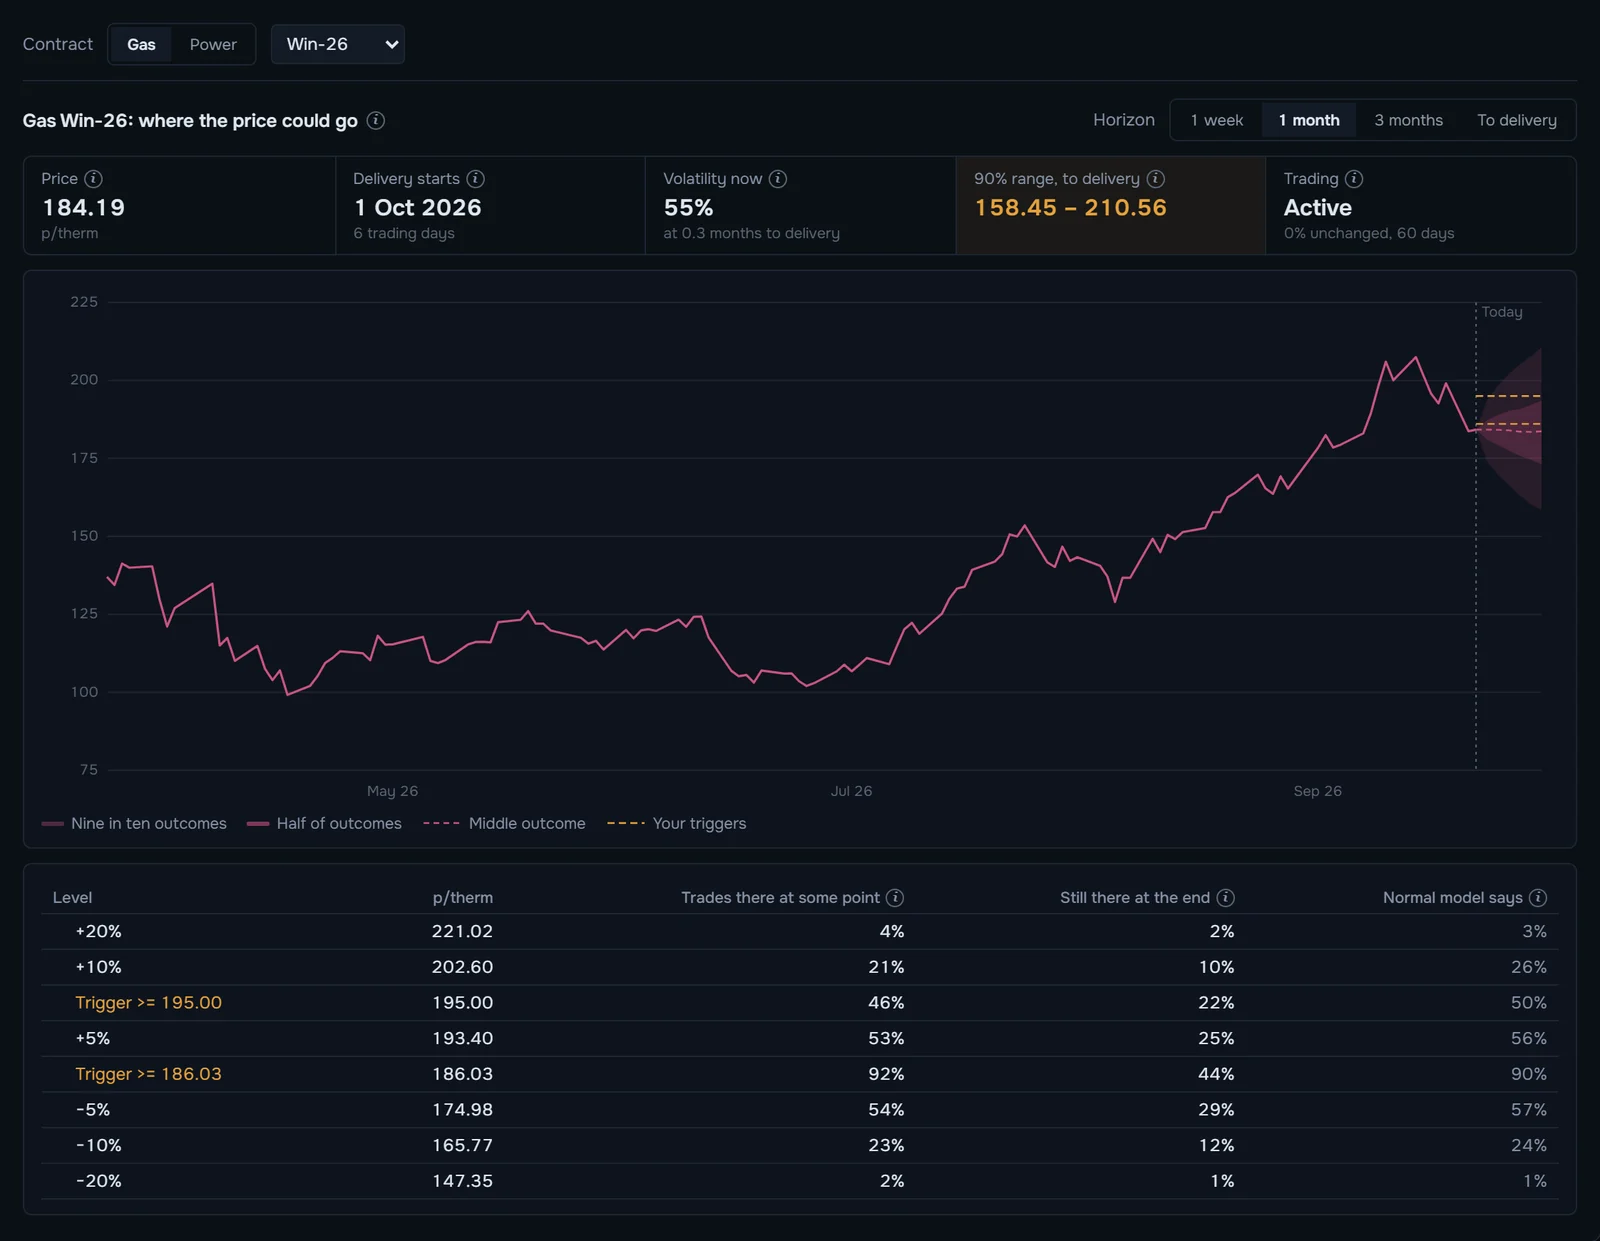
Price outlook. Where a contract could trade over a chosen horizon, and the chance of it reaching each level, including your own triggers.
Pro and Ultimate
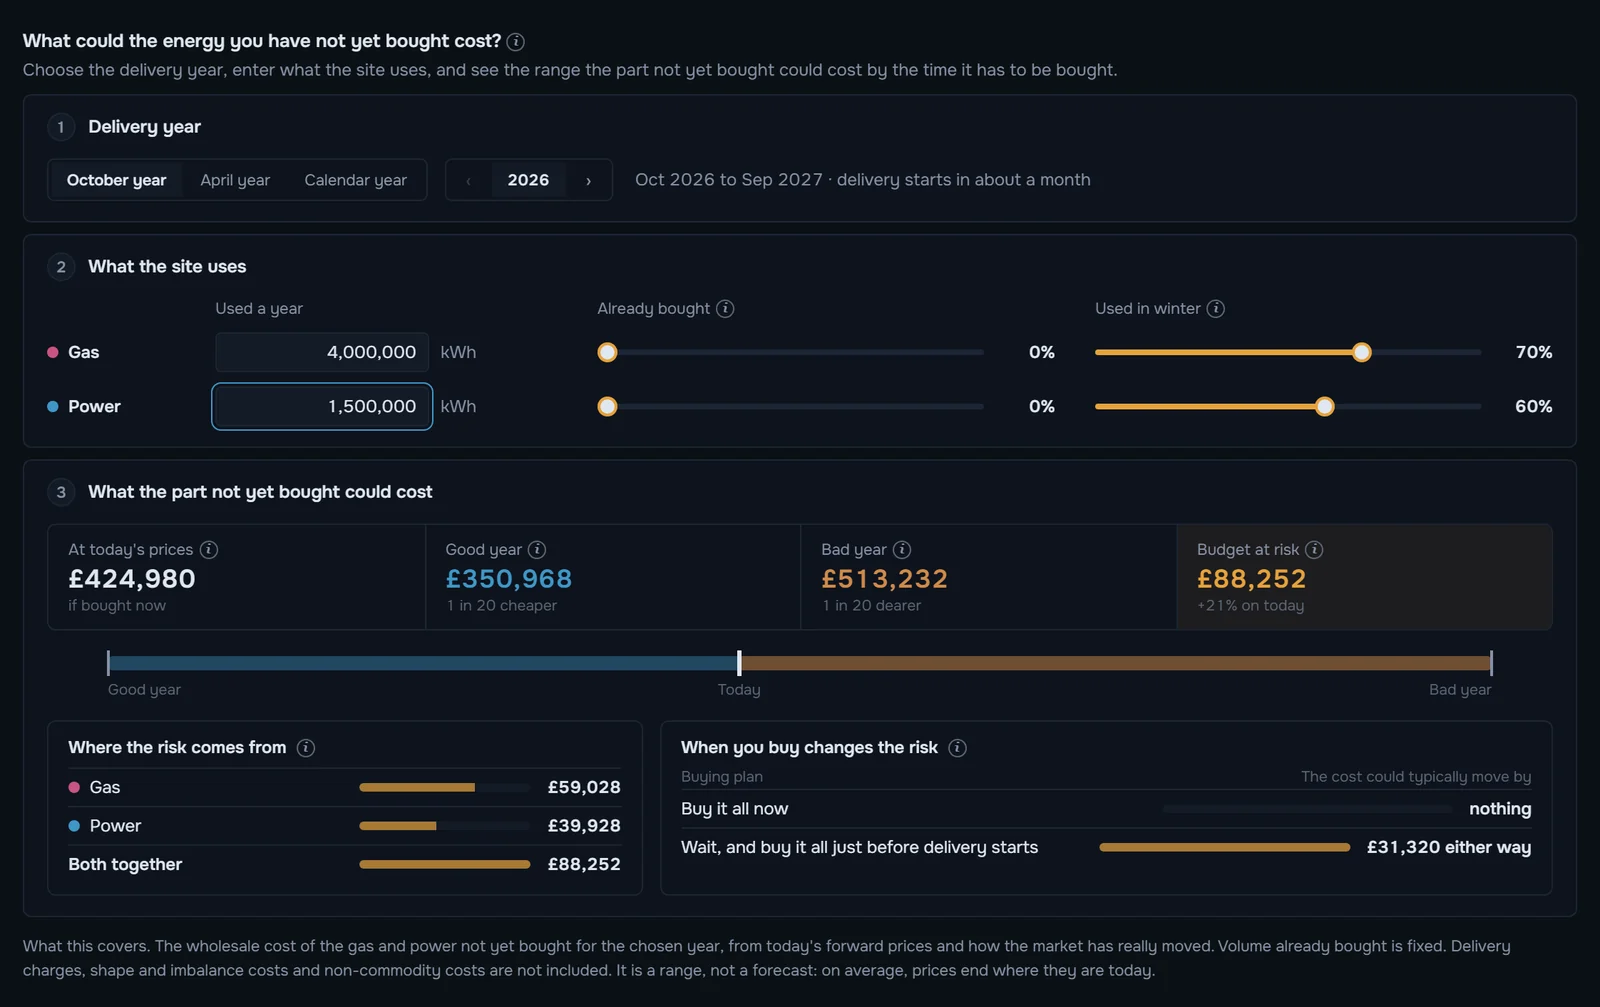
Budget at risk. Enter what a site uses and what is already bought, and see what the part not yet bought could cost in a good year and a bad one, in pounds.
Pro and Ultimate
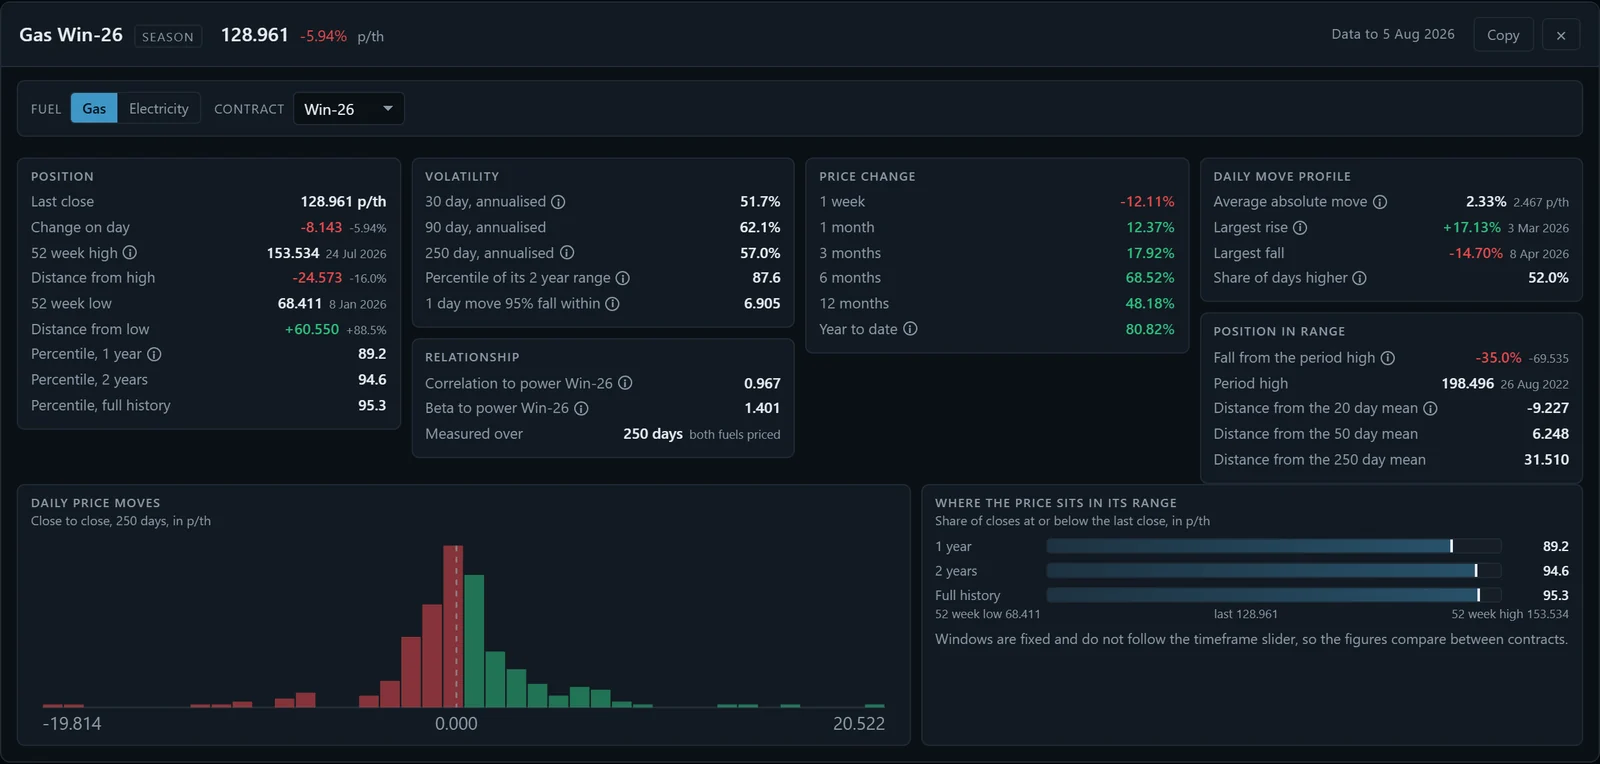
Statistics. Position, volatility, price change and the daily move profile for any contract, with where the price sits in its range.
Plus and up
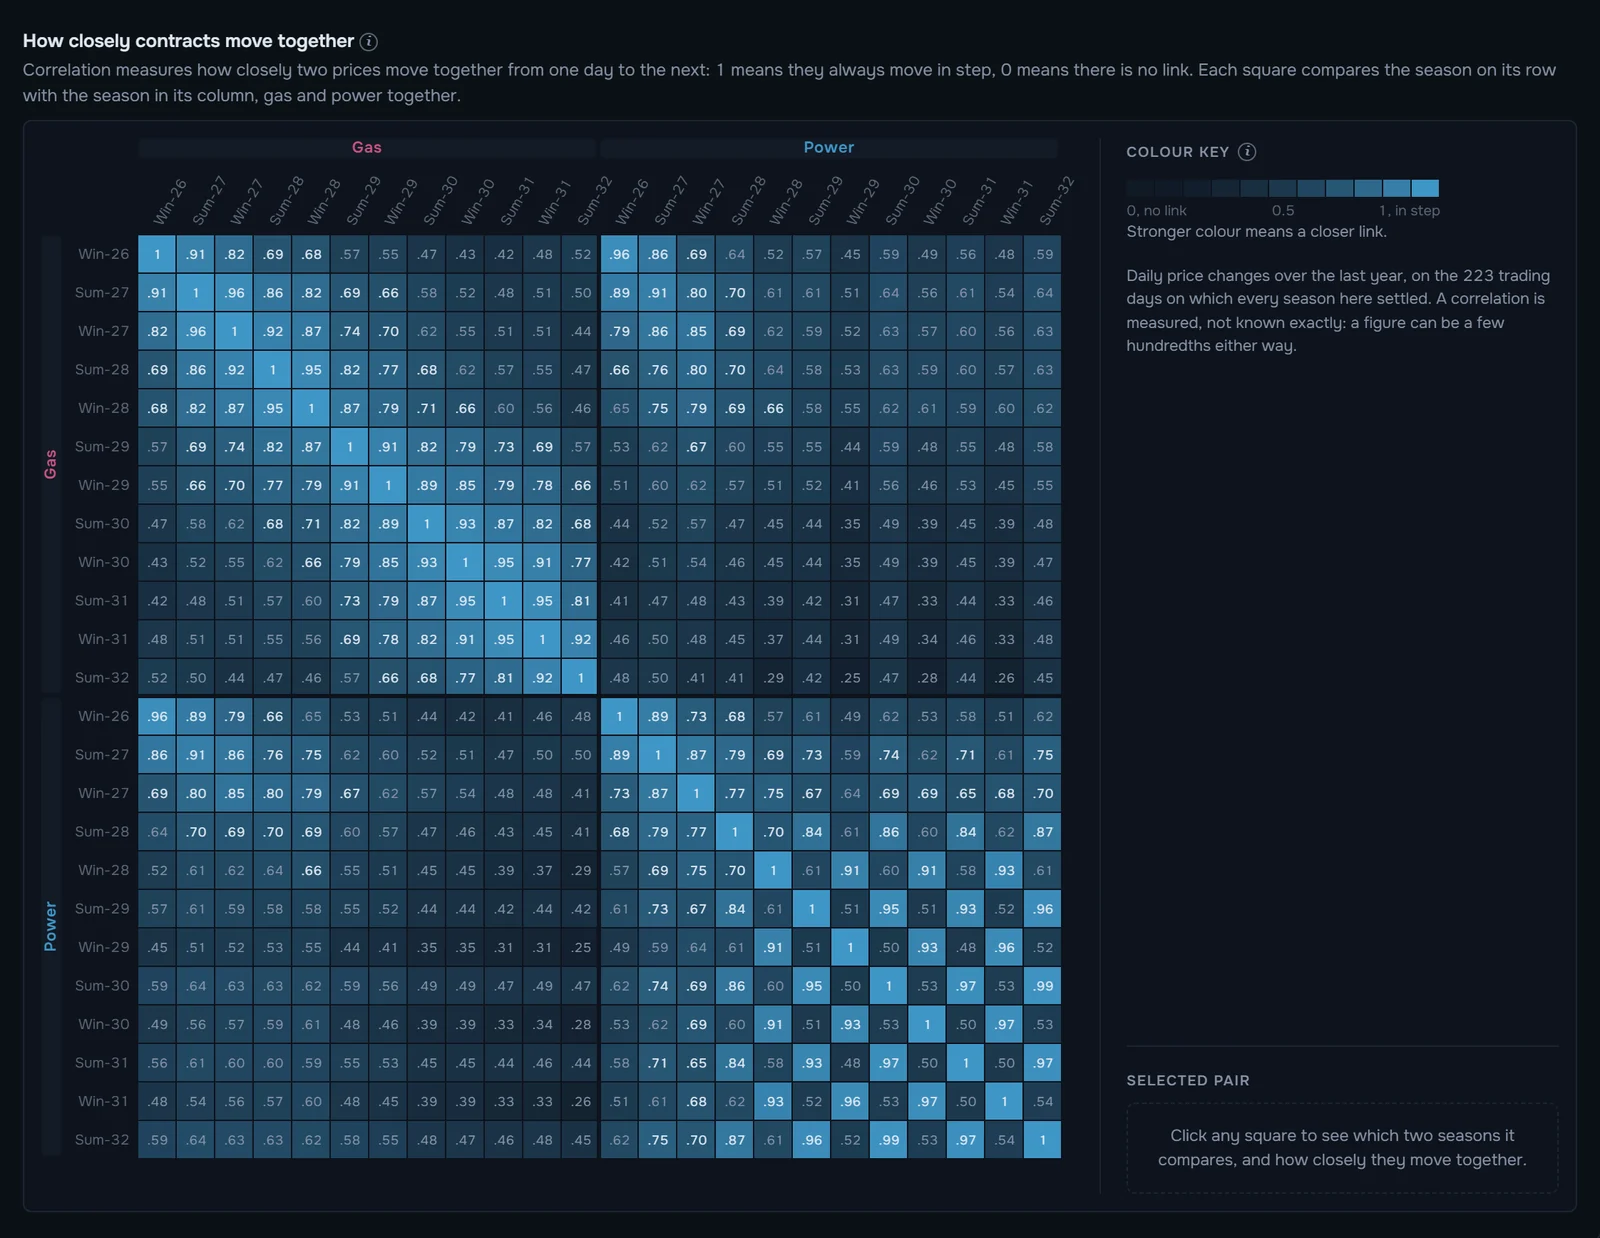
Correlation. How closely each season moves with the others, in gas and in power, on one grid.
Plus and up
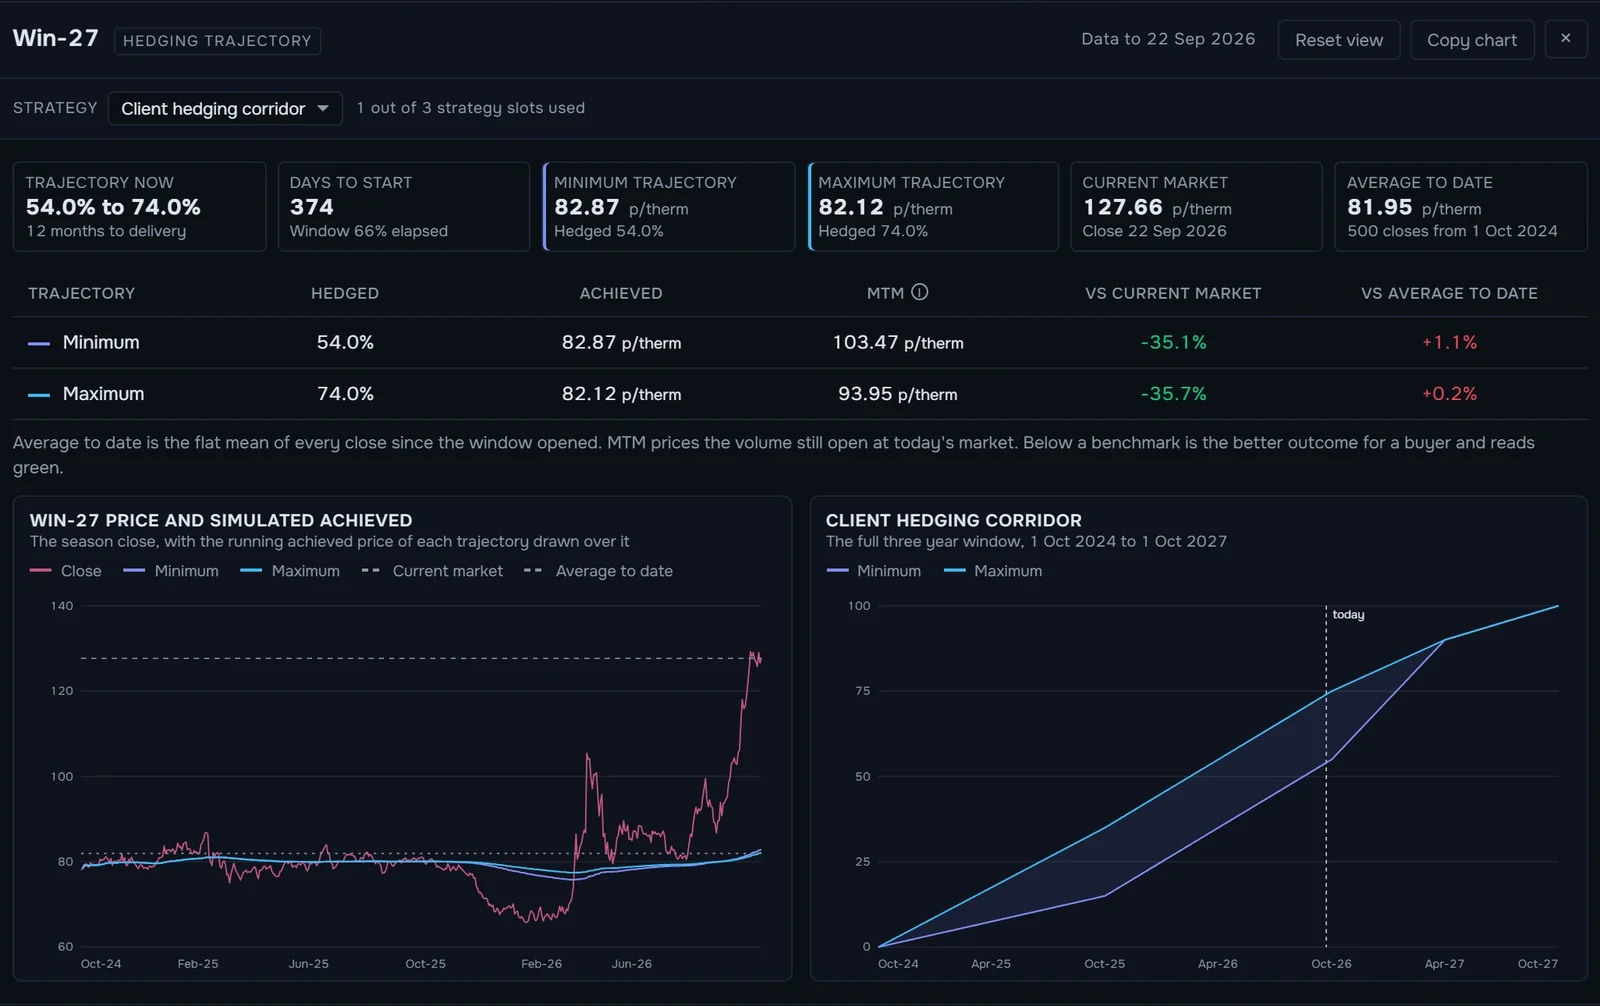
Hedging trajectories. Run your desk's minimum and maximum hedge percentages against the market, per season or across a multi-year strip. Save the strategy to your account.
Plus and up
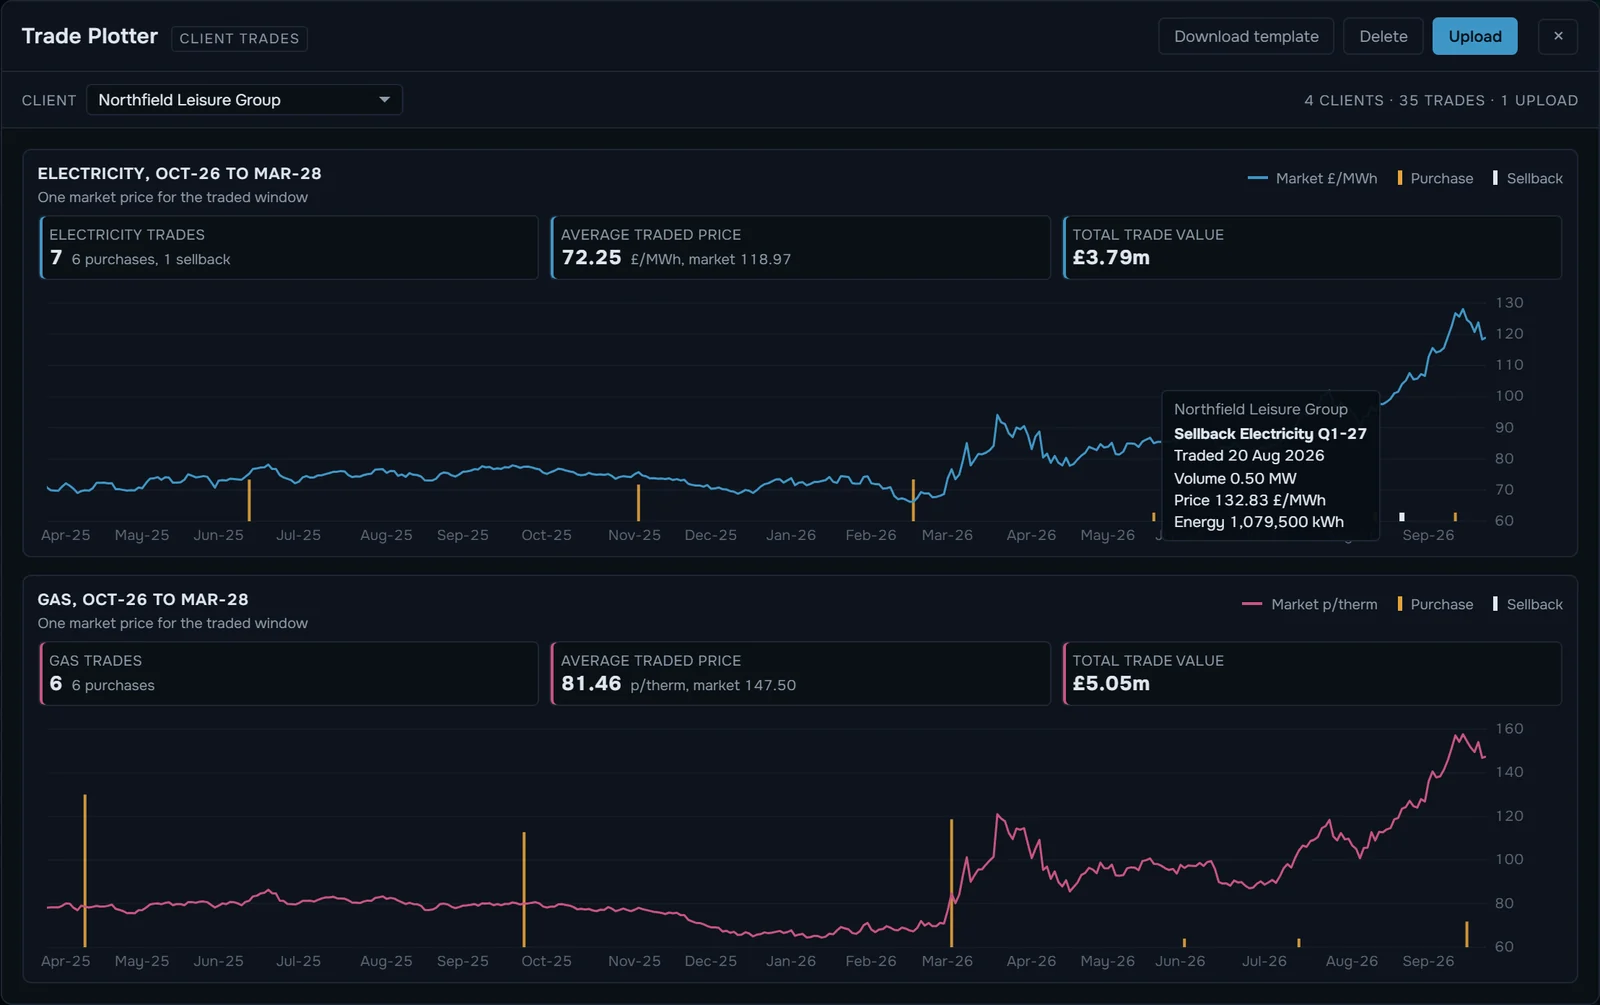
Trade Plotter. Upload a client's trades and see each one against the market it was struck in, with the average traded price for the window.
Pro and Ultimate
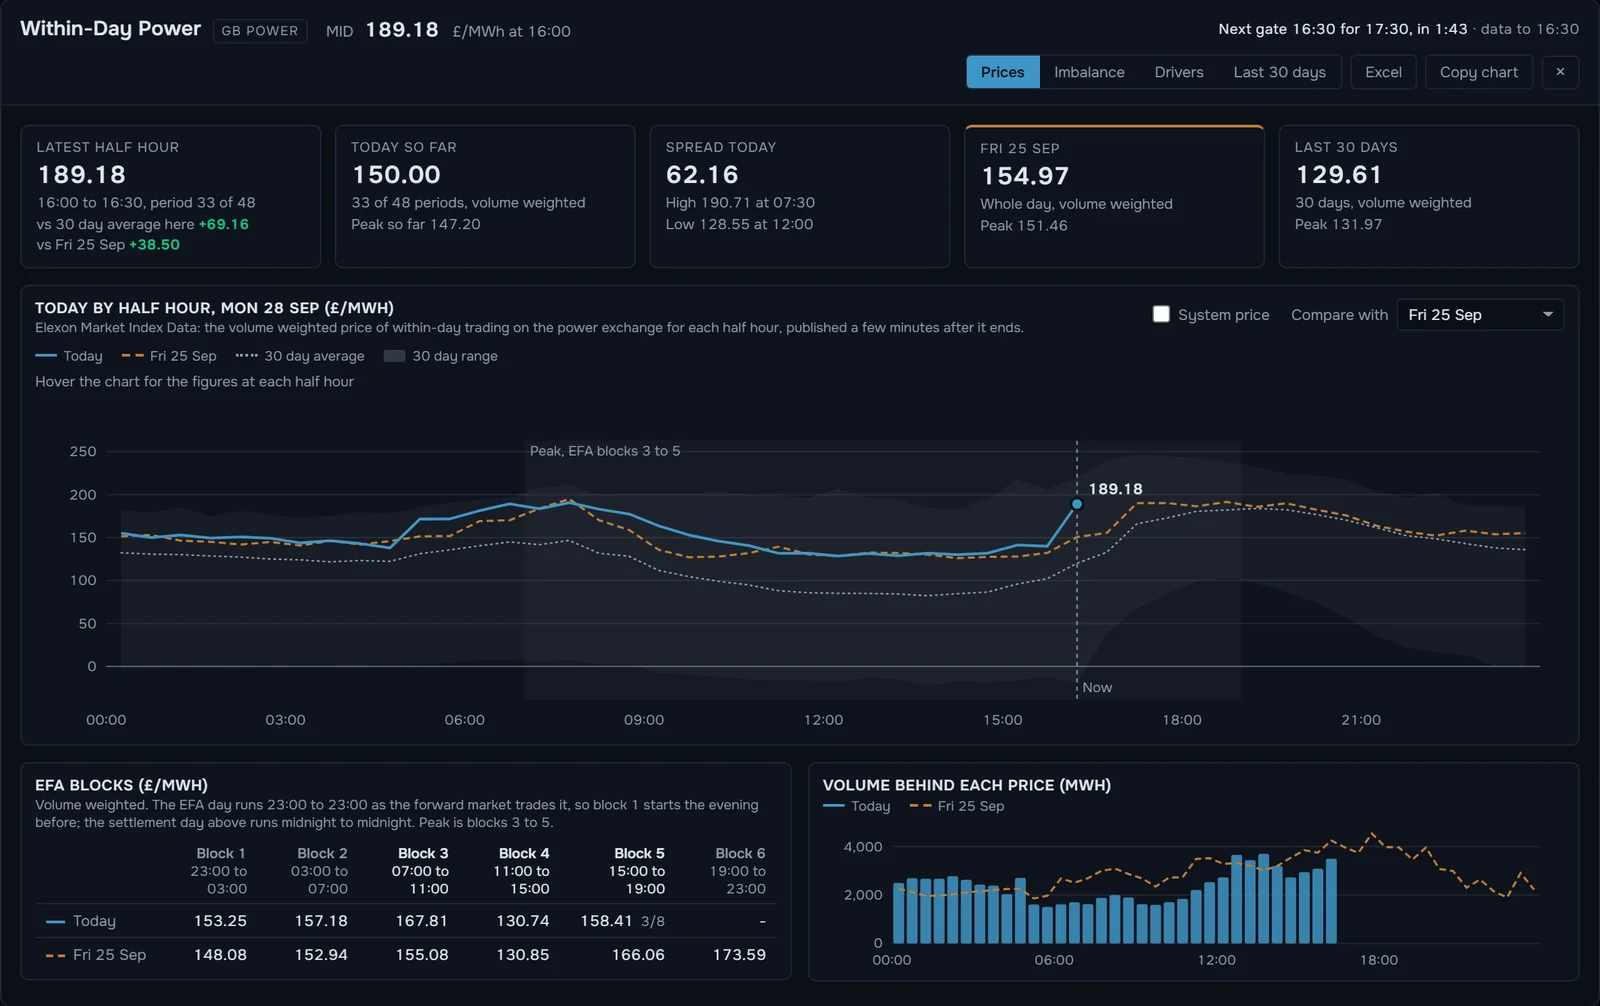
Within-Day Power. Half-hourly prices (MID), system price, imbalance and the wind and demand behind them, with a gate closure clock.
Ultimate
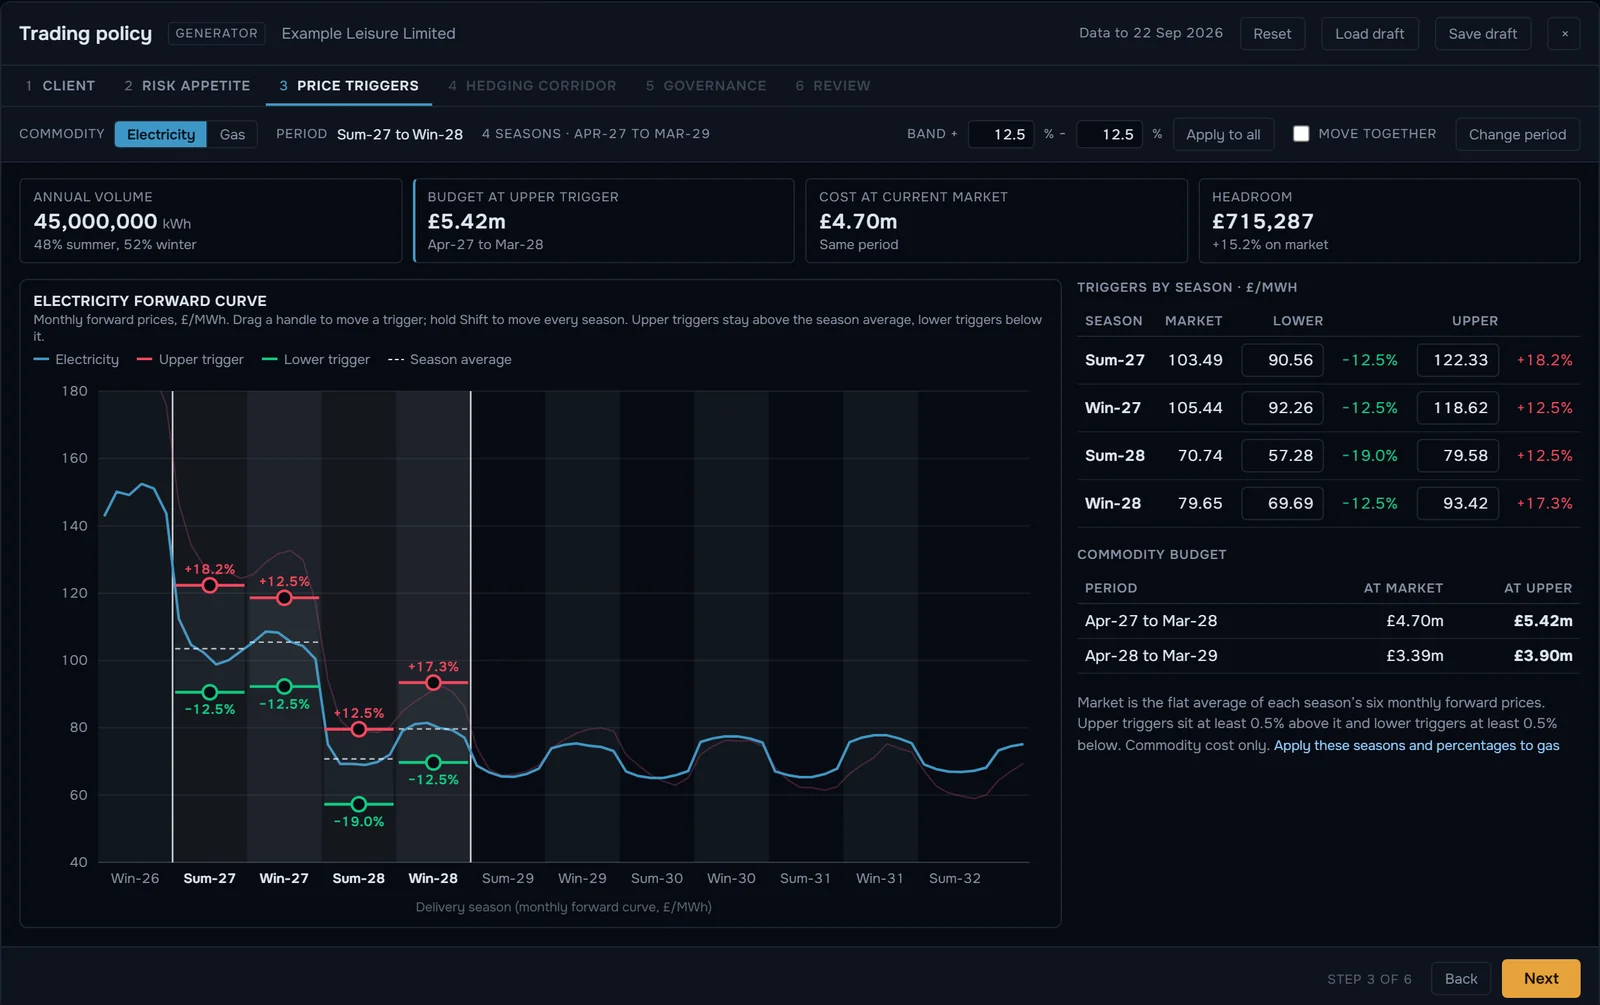
Trading policy generator. Build a client's risk policy step by step and export it to PDF. Ultimate includes three policies a month.
Ultimate
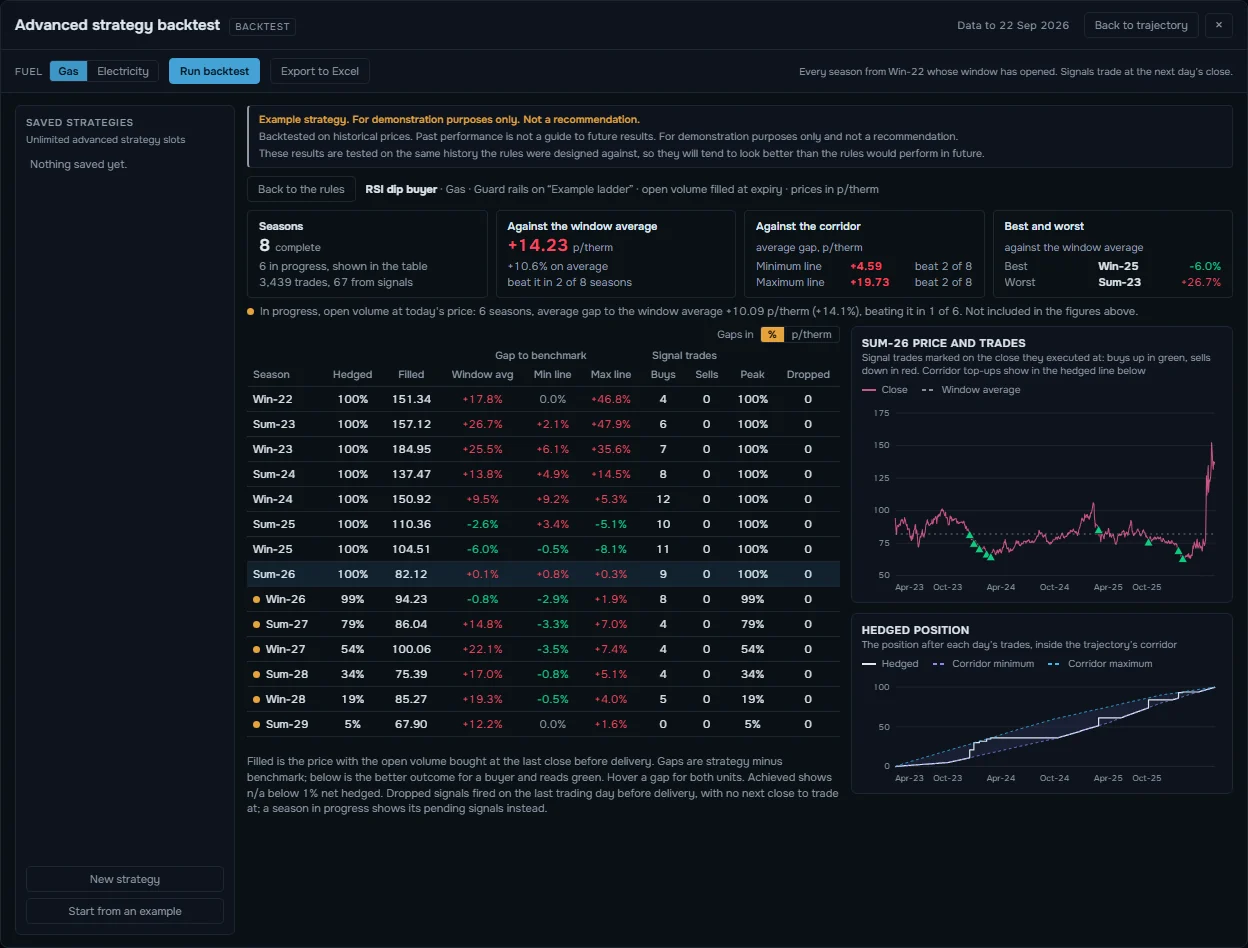
Advanced strategy backtest. Write your own trading rules and test them on every season since Win-22, then take the results out to Excel.
Ultimate
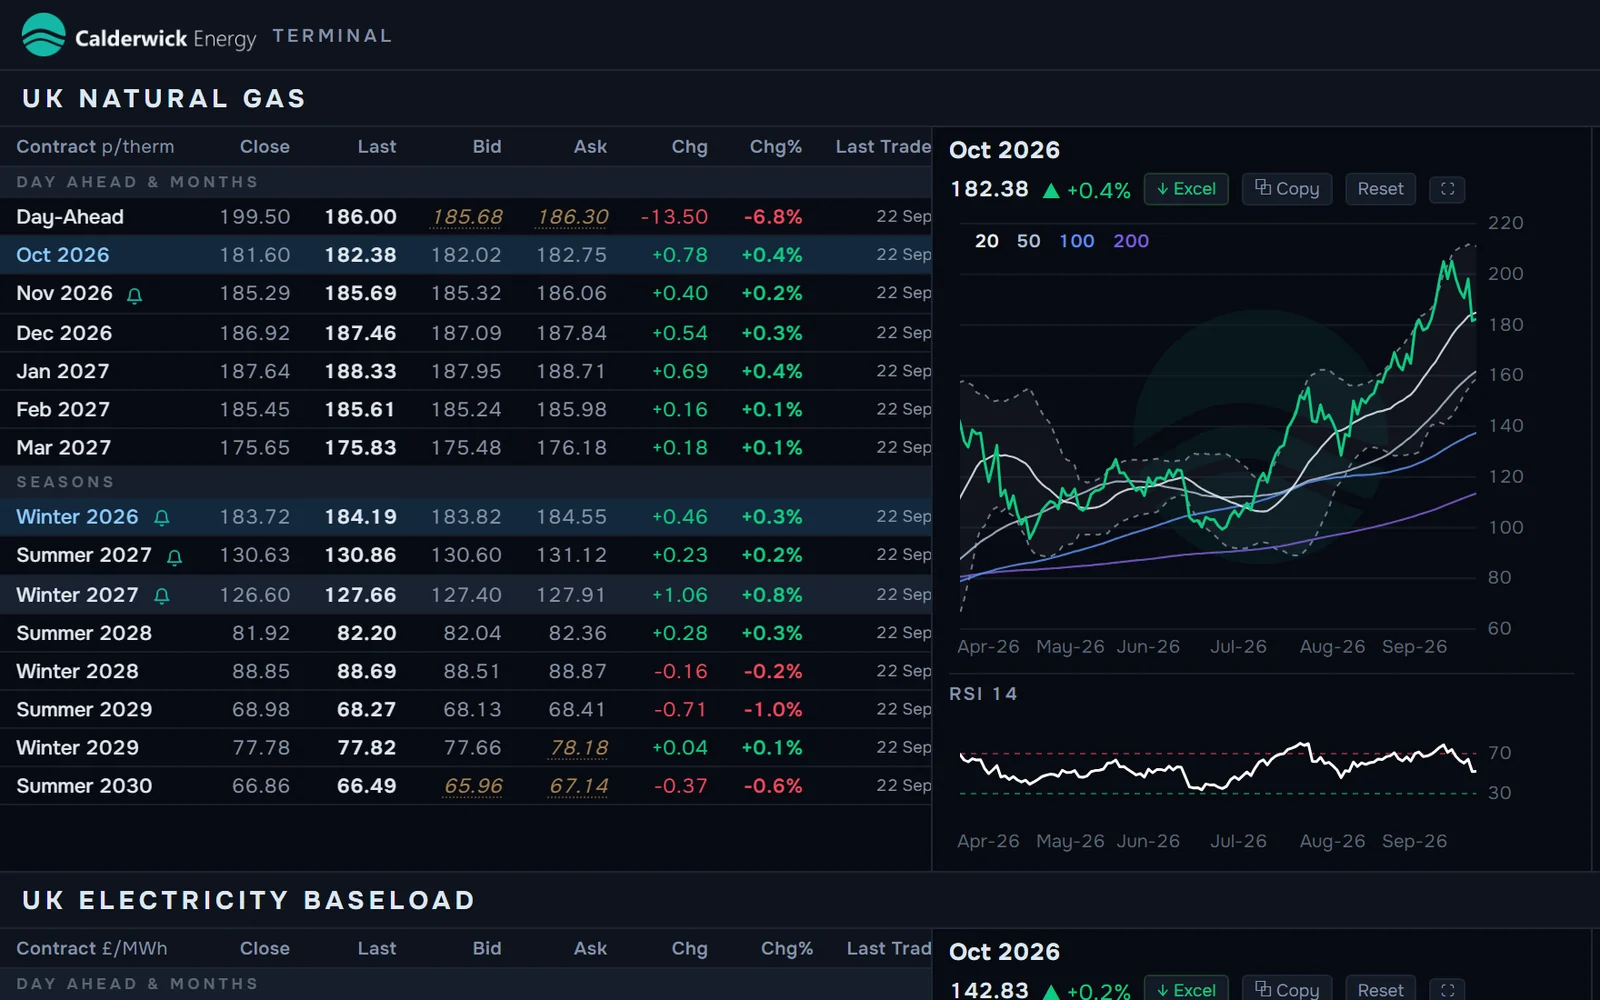
White labelling. Your logo, name and colour on the terminal, on every chart and on every export. Index sets it up for you.
Ultimate
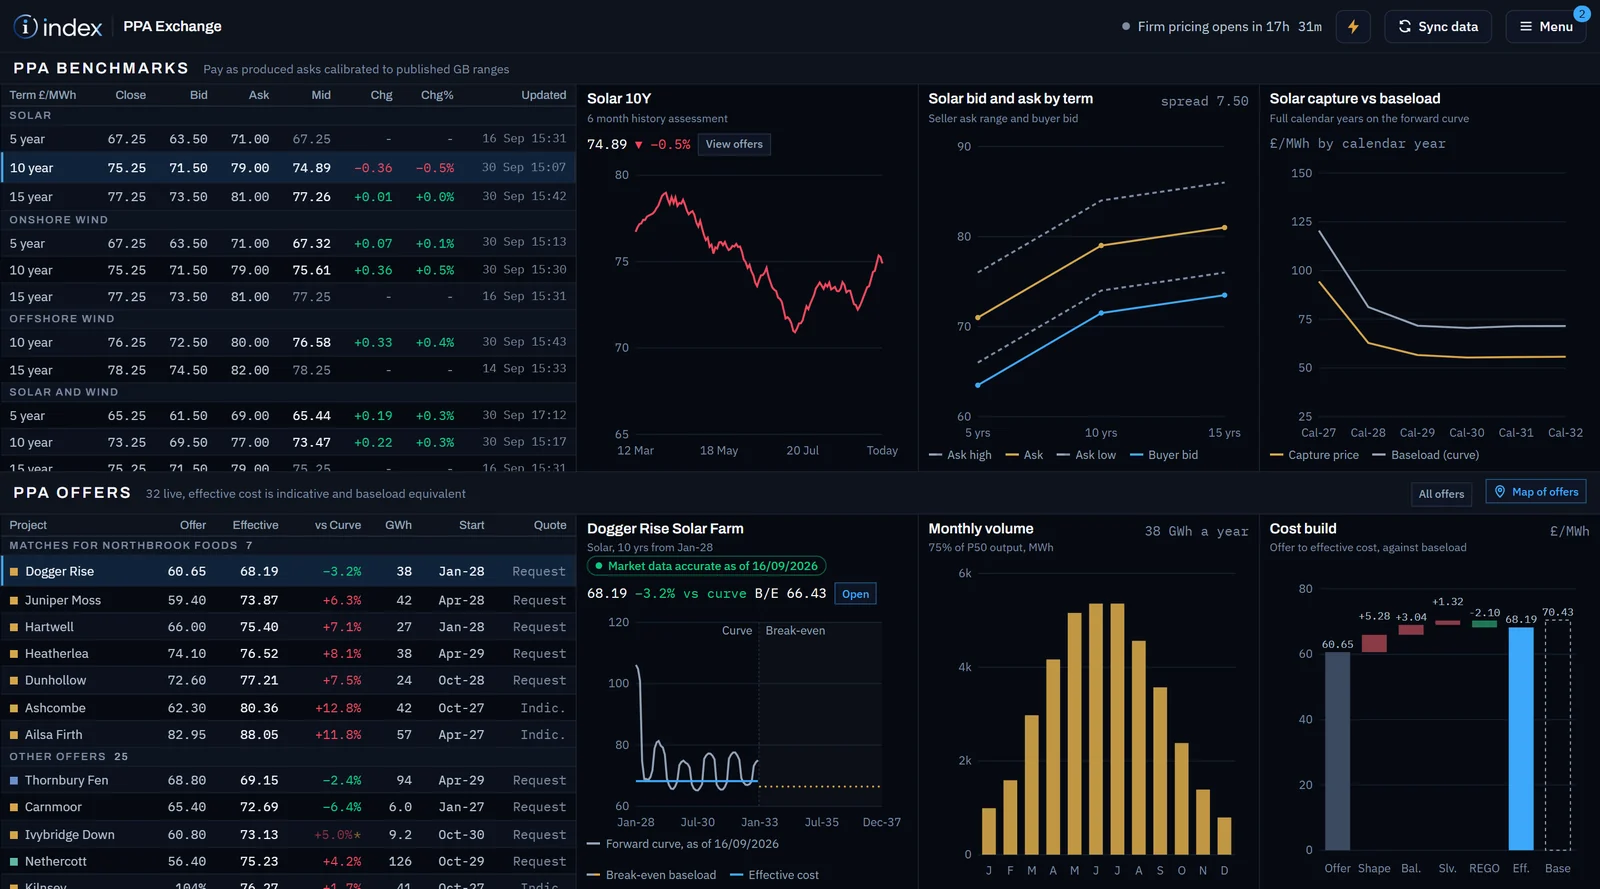
Index PPA Exchange, coming soon. UK solar and wind PPA offers set against the forward curve, with capture prices and the cost build to an effective price. Shown from the demo build.
Ultimate
Basic is a mobile licence: NBP gas and baseload power, day-ahead for both fuels, at the same closes as the terminal, with two weeks of closes per contract and the high, the low and the move.
It installs to the home screen and keeps the last snapshot without signal. Every other tier opens on a phone too, so the desk goes with you.
Choose Basic

Nothing to install and nothing on the desktop. Sign in and the screen is there, on any machine.
Prices refresh on a rolling cycle through the day, not once in the morning.
Each person holds a licence at the tier they need. Once you hold three, every further user is 25% off its tier price.
Basic puts the market on a phone. Lite is the full terminal on the desk, both fuels and the whole curve. A desk can run on it all day. Plus, Pro and Ultimate add the desk tools, tier by tier.
The market on a phone, away from the desk.
For a desk that needs the market on a screen.
For a team that cannot watch the screen all day.
For a desk that advises clients on the curve.
For within-day, PPAs and your own brand.
A short call with a screen share is usually enough to tell whether Index fits how your team works. If it does, we can have you on a live account in days rather than weeks.